NFL
Bills vs Dolphins: Odds, Picks & Implied Score
A fast, data-first look at Bills vs Dolphins: a quick table for spread, total, moneyline, and the implied score, plus model projections and matchup levers you can actually use. Prices move with injuries and weather—apply the formulas, compare books, and only act when the edge is real. Get your space game-day ready with FlagOh.
Bills vs Dolphins Odds Snapshot & Implied Score
Start here to see the market at a glance for Bills vs Dolphins. This snapshot compresses spread, total, moneyline, and the derived implied score into one scannable grid, with weather and key absences alongside for instant context. Read the Consensus row first, then scan the books for outlier numbers you can actually bet.
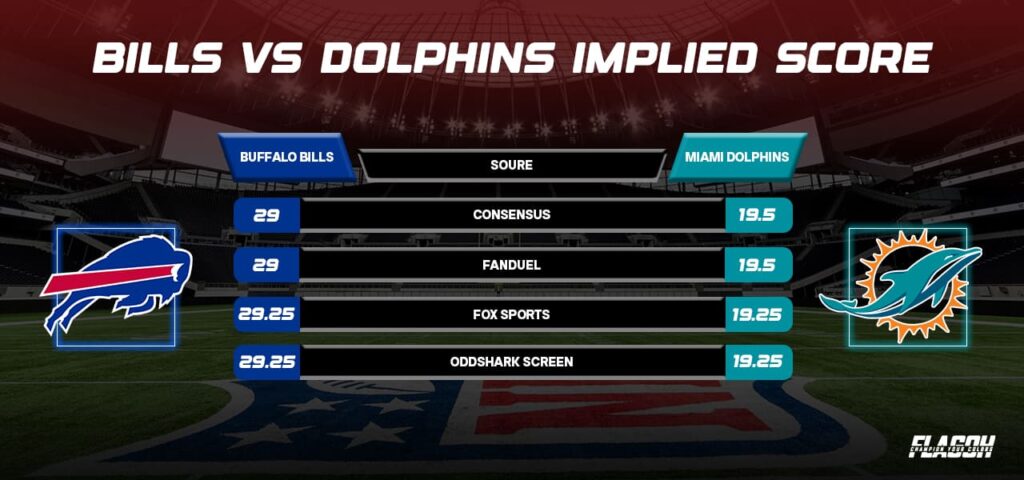
Quick Answers Table
| Book / Source | Spread (BUF/MIA) | Total | Moneyline (BUF/MIA) | Implied Score (BUF–MIA) |
| Consensus (range) | −9.5 −8.5 → −10) | 48.5 ( 47.5 → 48.5) | ≈ −500 / +400 ( −590 → −475 / +430 → +380) | 29.0 – 19.5 |
| FanDuel | −9.5 (−115) / +9.5 (−105) | 48.5 (O −115 / U −105) | −590 / +430 | 29.0 – 19.5 |
| FOX Sports | −10 / +10 | 48.5 | −521 / +392 | 29.25 – 19.25 |
| Oddshark screen | −10 / +10 (both −110) | 48.5 (−110) | −485 / +370 | 29.25 – 19.25 |
Formulas (use exact market numbers when you publish):
• Implied score = Total ÷ 2 ± Spread ÷ 2 (“favorite gets + Spread/2”).
• Implied win % from American odds:
– For positive (+A): 100 / (A + 100)
– For negative (−A): −A / (−A + 100)
• Break-even at −110 ≈ 52.38%.
| Source (Moneyline) | Implied Win % (BUF) | Implied Win % (MIA) | Book Hold/Vig | No-Vig Win % (BUF) | No-Vig Win % (MIA) |
| FanDuel Sportsbook (−590 / +430) | 85.51% | 18.87% | 4.38% | 81.92% | 18.08% |
| FOX Sports (−521 / +392) | 83.90% | 20.33% | 4.22% | 80.50% | 19.50% |
| Odds Shark (−485 / +370) | 82.91% | 21.28% | 4.18% | 79.58% | 20.42% |
Formulas (reference): See the Odds formulas above for implied score, American-to-probability, and hold/no-vig.
Consensus Lines Across Top Sportsbooks: Compare 3–5 books, note hold (≈4–6%) and limits near kickoff, and take the best number/lowest juice.
Implied Score & Win Probability — Formulas & Example
Walk a live example from the table: plug the total and spread to compute BUF/MIA implied points, then convert each moneyline to win probability. This makes pricing transparent and turns picks into falsifiable predictions.
Treat half-point swings or five-cent price gaps as meaningful, especially near key numbers. If nothing beats your fair line, log the prices and wait—late moves often create better entries. Always refresh the timestamp when you update, and grade your decisions against the closing numbers afterward.
Prediction & Key Matchups
What this section does: turns film + data into bettable edges—publishing a fair line with confidence bands, identifying matchup levers (pressure vs time-to-throw, YPRR vs coverage, red-zone tilt), and layering injury/venue context.
Bills vs Dolphins Prediction:
We publish fair spread/total, win probability, edge %, and confidence bands, then compare to current market odds.
Methodology & Inputs:
- Windows: last 4 and last 8 games, plus season-to-date (opponent-adjusted).
- Core metrics: EPA/play, success rate, explosive play %, pressure rate, red-zone TD%, pace.
- Simulation: ~10,000 Monte Carlo runs → distributions for spread/total and fair ML.
- Transparency: cite sources + update time.
Model Output vs Market:
Show projected spread and total vs consensus, with edge % and confidence intervals. If the edge is small or the juice is high, pass; track CLV (Closing Line Value) over time.
Matchups That Move Numbers:
- Passing: pressure rate vs time-to-throw; QB CPOE; WR YPRR; explosive pass %.
- Rushing/early downs: early-down success; short-yardage EPA.
- Scoring levers: red-zone TD% and third-down EPA shift totals and volatility.
Buffalo Bills vs Miami Dolphins Match Player Stats:
Spot leverage by pairing player form with opponent tendencies.
| Bucket | Bills | Dolphins | Why it matters |
| QB EPA/CPOE | EPA/play (Josh Allen): 0.31 on 61 plays (CPOE unavailable from this source) | EPA/play (Tua Tagovailoa): −0.56 on 27 plays (CPOE unavailable) | Per-play efficiency correlates with fair ML & win probability. |
| WR YPRR (top 2) | Keon Coleman 2.11, Khalil Shakir 1.31 (2025 to date) | Tyreek Hill 1.74, Jaylen Waddle 1.36 (2025 to date) | YPRR signals reception/yard props and target distribution. |
| Pressure rate (DEF) | Sack% proxy: 9.09% (2025) | Sack% proxy: 3.03% (2025) | Pressure affects drive success and totals when the true pressure% isn’t published. |
Act only when your fair number clears a key threshold (≈ 0.5–1.0 pts on spread, 1.5–2.0 pts on total, or +2–3% above break-even on the ML). If signals conflict, skip the side/total and pivot to derivatives that fit the strongest lever (e.g., QB rush yards when pressure projects up, WR receptions when YPRR/target share trend up). Keep stakes disciplined (flat units or fractional Kelly) and move on.
Recent Bills vs Dolphins History
What this section does: frames pace, explosives, and situational context using the last five meetings—useful for narrative checks, but don’t overfit.
Glossary: ATS = Against the Spread; O/U = Over/Under
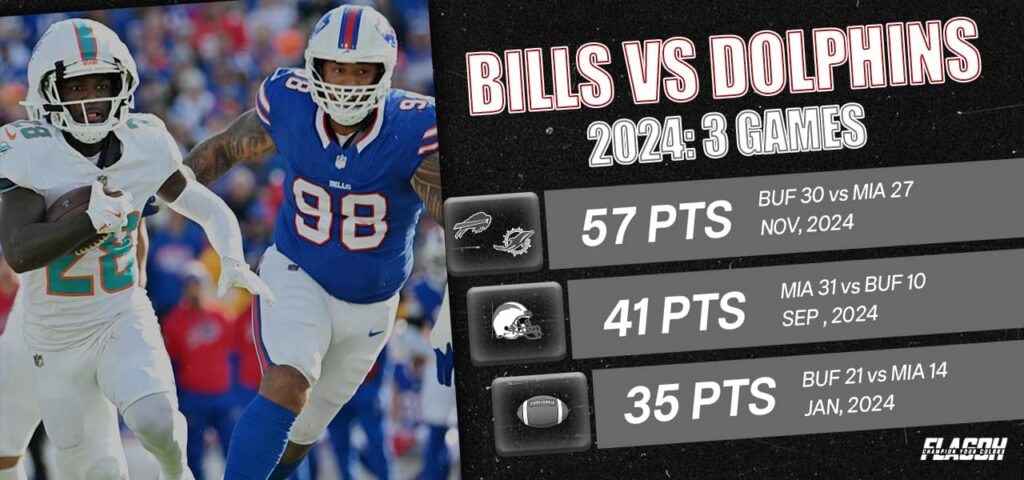
| Date | Site | Final (BUF–MIA) | ATS Result (vs. closing spread) | O/U Result (vs. closing total) |
| Nov 3, 2024 | BUF | 30–27 | MIA +6.5 covered (BUF −6.5) | Over (49 → 57) |
| Sep 12, 2024 | MIA | 31–10 | BUF +2.5 covered (MIA −2.5) | Under (49 → 41) |
| Jan 7, 2024 | MIA | 21–14 | BUF −2.5 covered | Under (48 → 35) |
| Oct 1, 2023 | BUF | 48–20 | BUF −3 covered | Over (52.5 → 68) |
| Jan 15, 2023 (WC) | BUF | 34–31 | MIA +14 covered (BUF −14) | Over (44.5 → 65) |
How to use it: divisional rematch dynamics, home/road splits, and red-zone efficiency trends can inform expectations—but let current injuries, matchup rates, and weather drive the final number.
Market Drivers: Line Movement, Injuries & Weather
Between posting and kickoff, prices react to three forces—information (practice reports → inactives), environment (sustained wind, heat index, roof status), and money (limits, screens, and consensus). Use this section to set alert thresholds around key numbers (e.g., 3/7/10), watch participation trends rather than single tags, and sanity-check totals against real-time weather rather than day-ahead forecasts.
Bills vs Dolphins Injury Report & Inactives
The Bills vs Dolphins injury report drives late line moves. Track DNP/LP/FP tags through the 48-hour window and re-price once inactives drop (~90 minutes pre-kick). A starting CB OUT often nudges the total up (explosive pass rate ↑), while a LT OUT can depress QB efficiency and widen the spread.
Quick read:
- Participation: DNP → LP → FP trends matter more than one-off tags.
- Snap-share: If WR1 is limited, check WR3/TE1 routes/run-block splits for prop pivots.
- Adjustments: Move 0.5–1.0 pt for premier OL/CB; more for QB.
Open→Close Timeline & CLV (Closing Line Value)
Chart open → limits up → steam → close. Note catalysts (injury report, weather bump, market consensus). Log your ticket price vs close to measure CLV and expected ROI.
Weather & Venue Thresholds
- Wind > 15 mph: deep passing rates fall; totals often compress.
- Heat/humidity: pace and rotation change in Miami; heat index matters for second-half efficiency.
- Roof/field status: surface and shade patterns can influence footing and WR separation.
Before you place or pass, run a quick triage: 1) confirm the latest participation report and anticipated inactives window, 2) reprice with current now-cast conditions, 3) scan multiple books for the best number/juice. If the market never gifts value, preserve bankroll, pivot to props that align with the day’s conditions, and document what moved the screen for next time.
Props & Picks
Data-Backed Prop Angles & Same-Game Parlay Ideas
- QB/WR/RB props: QB passing yards/TDs, WR receptions/YPRR, RB rush + receiving splits tied to opponent tendencies.
- SGP construction: Correlate pace, pressure, and target share. Consider alt lines, anytime TD, QB rush yards, and prudent ladder bets.
- Risk note: Avoid negative correlation traps; respect book limits.
Picks Card
List sides/totals/props with unit size, price, book, and time posted. Keep a public pick sheet and link back to the CLV note in the Odds section.
Finish your game-day setup with a Bills vs Dolphins House Divided flag by FlagOh.
Bankroll Guardrails
- Break-even table: −105 (51.22%), −110 (52.38%), −115 (53.49%), −120 (54.55%).
- Staking: flat units or modest Kelly fraction; log unit P/L, variance, and outcomes.
- Compliance: bet with legal books only (geo-fenced; KYC); know push rules (2-way vs 3-way markets).
Bills vs Dolphins Mini-FAQ
Short, punchy answers to the most common pre-game betting questions—implied score math, moneyline conversions, why lines jump near kickoff, injury impact, weather thresholds, SGP basics, and push rules. Each reply is one line and points you to the deeper section if you want more.
How do you calculate the implied score for Bills vs Dolphins?
Use Total ÷ 2 ± Spread ÷ 2 (favorite gets the plus). Then convert moneylines to probabilities to sanity-check.
What does −3.5 mean in this matchup?
The Bills must win by 4+ to cover; the Dolphins cover at +3.5 with a loss by ≤3 or any win.
How do I convert −120 moneyline to win probability?
For negative odds: 120 / (120 + 100) = 54.55%.
Why did the line move before kickoff?
Injury updates, weather shifts, limits increasing, or sharp action changing the market consensus (and book hold/juice).
Which injuries matter most this week?
Offensive tackles, CB1/CB2, and QB health typically move the number most; check DNP/LP/FP and the 90-minute inactives.
Does Miami wind or heat change the total?
Yes. Wind > 15 mph often suppresses explosives; high heat index can slow late-game pace.
What are smart same-game parlay legs?
Correlated legs only (e.g., pressure edge → QB rush yards ↑; WR target share ↑ → receptions/alt lines). Avoid opposing outcomes.
Is it better to bet early or close to game time?
Early for numbers before limits/steam if you trust your edge; late for confirmed injuries/weather and market efficiency.
What are push rules on spreads/totals?
In 2-way markets, landing on the number typically pushes (stake returned). 3-way markets handle ties differently—read the rules.
How much is home-field advantage worth here?
Typically 1.5–2.0 points, but varies by matchup, travel, and weather.
Before you act, sanity-check prices in the Odds Snapshot, re-verify participation/inactives, confirm your book’s rules, and log the entry so you can grade it against the close. If something isn’t covered here, use page search or jump links to find the right section fast. For Bills vs Dolphins, shop a few books for the best number and lowest juice, compare it to your fair line, and wait for the 90-minute inactives after double-checking wind and heat. If the edge isn’t there, skip, log your price, and use postgame highlights/usage to refine your next props. When you’re set for kickoff, finish the vibe with team or NFL House Divided flags from FlagOh.
 Arizona Cardinals Flag
 Atlanta Falcons Flag
 Baltimore Ravens Flag
 Buffalo Bills Flag
 Carolina Panthers Flag
 Chicago Bears Flag
 Cincinnati Bengals Flag
 Cleveland Browns Flag
 Dallas Cowboys Flag
 Denver Broncos Flag
 Detroit Lions Flag
 Green Bay Packers Flag
 Houston Texans Flag
 Indianapolis Colts Flag
 Jacksonville Jaguars Flag
 Kansas City Chiefs Flag
 Las Vegas Raiders Flag
 Los Angeles Chargers Flag
 Los Angeles Rams Flag
 Miami Dolphins Flag
 Minnesota Vikings Flag
 New England Patriots Flag
 New Orleans Saints Flag
 New York Giants Flag
 New York Jets Flag
 Philadelphia Eagles Flag
 Pittsburgh Steelers Flag
 San Francisco 49ers Flag
 Seattle Seahawks Flag
 Tampa Bay Buccaneers Flag
 Tennessee Titans Flag
 Washington Commanders Flag
 Arizona Diamondbacks Flag
 Atlanta Braves Flag
 Baltimore Orioles Flag
 Boston Red Sox Flag
 Chicago Cubs Flag
 Chicago White Sox Flag
 Cincinnati Reds Flag
 Cleveland Guardians Flag
 Colorado Rockies Flag
 Detroit Tigers Flag
 Houston Astros Flag
 Kansas City Royals Flag
 Los Angeles Angels Flag
 Los Angeles Dodgers Flag
 Miami Marlins Flag
 Milwaukee Brewers Flag
 Minnesota Twins Flag
 New York Mets Flag
 New York Yankees Flag
 Oakland Athletics Flag
 Philadelphia Phillies Flag
 Pittsburgh Pirates Flag
 San Diego Padres Flag
 San Francisco Giants Flag
 Seattle Mariners Flag
 St. Louis Cardinals Flag
 Tampa Bay Rays Flag
 Texas Rangers Flag
 Toronto Blue Jays Flag
 Washington Nationals Flag
 Atlanta Hawks Flag
 Boston Celtics Flag
 Brooklyn Nets Flag
 Charlotte Hornets Flag
 Chicago Bulls Flag
 Cleveland Cavaliers Flag
 Dallas Mavericks Flag
 Denver Nuggets Flag
 Detroit Pistons Flag
 Golden State Warriors Flag
 Houston Rockets Flag
 Indiana Pacers Flag
 LA Clippers Flag
 Los Angeles Lakers Flag
 Memphis Grizzlies Flag
 Miami Heat Flag
 Milwaukee Bucks Flag
 Minnesota Timberwolves Flag
 New Orleans Pelicans Flag
 New York Knicks Flag
 Oklahoma City Thunder Flag
 Orlando Magic Flag
 Philadelphia 76ers Flag
 Phoenix Suns Flag
 Portland Trail Blazers Flag
 Sacramento Kings Flag
 San Antonio Spurs Flag
 Toronto Raptors Flag
 Utah Jazz Flag
 Washington Wizards Flag
 Anaheim Ducks Flag
 Arizona Coyotes Flag
 Boston Bruins Flag
 Buffalo Sabres Flag
 Calgary Flames Flag
 Carolina Hurricanes Flag
 Chicago Blackhawks Flag
 Colorado Avalanche Flag
 Columbus Blue Jackets Flag
 Dallas Stars Flag
 Detroit Red Wings Flag
 Edmonton Oilers Flag
 Florida Panthers Flag
 Los Angeles Kings Flag
 Minnesota Wild Flag
 Montreal Canadiens Flag
 Nashville Predators Flag
 New Jersey Devils Flag
 New York Islanders Flag
 New York Rangers Flag
 Ottawa Senators Flag
 Philadelphia Flyers Flag
 Pittsburgh Penguins Flag
 San Jose Sharks Flag
 Seattle Kraken Flag
 St. Louis Blues Flag
 Tampa Bay Lightning Flag
 Toronto Maple Leafs Flag
 Vancouver Canucks Flag
 Vegas Golden Knights Flag
 Washington Capitals Flag
 Winnipeg Jets Flag
 Auburn Tigers Flag
 Clemson Tigers Flag
 Florida Gators Flag
 Florida State Seminoles Flag
 Michigan Wolverines Flag
 Nebraska Cornhuskers Flag
 Notre Dame Fighting Irish Flag
 Ohio State Buckeyes Flag
 Oklahoma Sooners Flag
 Oregon Ducks Flag
 Penn State Nittany Lions Flag
 South Carolina Gamecocks Flag
 Tennessee Volunteers Flag
 Texas A&M Aggies Flag
 Texas Longhorns Flag
 USC Trojans Flag